
Non-spatial, Attribute, & Tabular Data
Non-spatial data (also known as attribute or tabular data) is information independent of the spatial component of GIS data. Bringing this data into the GIS environment is a powerful and essential tool for expanding geospatial research.
"Joins" can be used to attach tables to existing shapefiles based on a common field, giving them new geography. For example, an excel dataset of income could be joined to a shapefile of census blocks, which combines the two and provides the excel data with spatial context.
The U.S. Census Bureau, with surveys such as the Decennial Census and the American Community Survey, is an essential source for non-spatial datasets. Unfortunately, the Census Bureau data explorer can be hard to navigate and lacks a straightforward way to visualize data before download.
The University of Arizona provides several tools for searching, visualizing, and aggregating large datasets on a map platform. Both PolicyMap and Social Explorer are available using a NetID login.
- PolicyMap is best used to map contemporary policy and demographic issues and includes data from the last 20 to 30 years. PolicyMap works well at a local level but can also be used at a national scale.
- Social Explorer is best used to search for historical census data, with datasets dating back to the first census. Social Explorer works well at a national level but can also be used at a local scale.
To determine which is best suited for specific research, compare the data dictionary of the two services;
PolicyMap is a state-of-the-art data and analytics engine. The site provides over 50,000 indicators from hundreds of sources, including data from governments, healthcare, universities, nonprofits, libraries, and more. PolicyMap users are both non-GIS professionals as well data-literate practitioners and researchers.
PolicyMap can be accessed by using a University of Arizona login here.
These are general tips for getting started with PolicyMap. More in-depth tutorials can be found below.
|
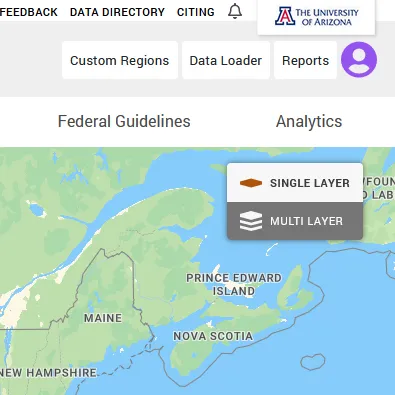
Login to PolicyMap with a UA NetId for full access to the site. Once logged in, make an individual account for saving work and projects. These logins are visible in the top right corner of the screen, as well as the data dictionary, report generator, and data loader for uploading additional data. |
|
|
Image
|
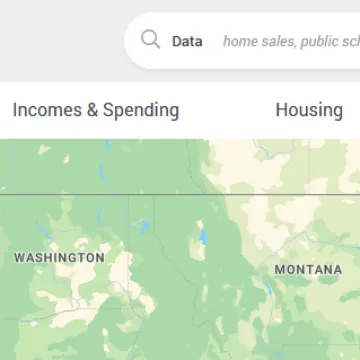
Data can be added to the map by using the search bar or the tabs under the search bar. Data is available for display by geographic area or by points on the map. Up to five data layers can be displayed simultaneously and used to create tables and reports. These tables can be added to GIS projects. |
|
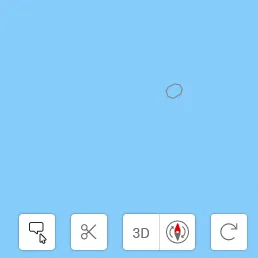
In the bottom right is the setting tabs. Turn hover on and off, clip data to a specific shape or region, or change the map view. |
|
|
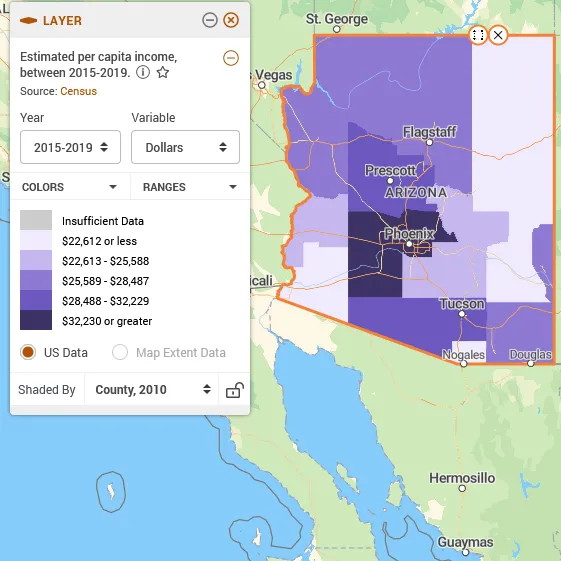
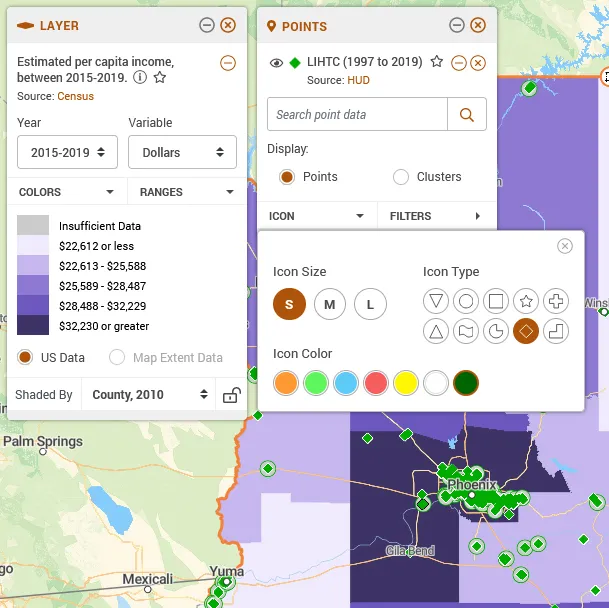
When a data layer is displayed for a specific region or area, the data can be fine-tuned to match the desired outputs. Settings such as year, variable, color, and range can be adjusted. |
| Both layers and points can be displayed simultaneously. Points have additional settings that allow for changing the icon size, type, and color. |
|
Additional PolicyMap tutorials can be found here and below.
Social Explorer provides easy access to demographic information about the United States. Based around US Census data, there are thousands of interactive data maps going back to 1790.
Social Explorer can be accessed by using a University of Arizona login here.
These are general tips for getting started with Soical Explorer. More in-depth tutorials can be found below.

|
Login to Social Explorer with a UA NetId for full access to the site. Once logged in, make an individual account for saving work and projects. These logins are visible in the top right corner of the screen, as well as a help icon that includes an introduction to maps and an introduction to reports. |
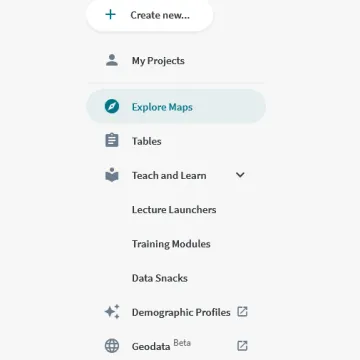
| On the left side of the page are the starting points for creating different projects. 'Creating a new project' starts a blank template while 'exploring maps' allows for adding data to pre-existing templates. 'Geodata' allows for downloading specific maps as shapefiles that include both spatial and non-spatial data. |
Image
|
|
Image
|
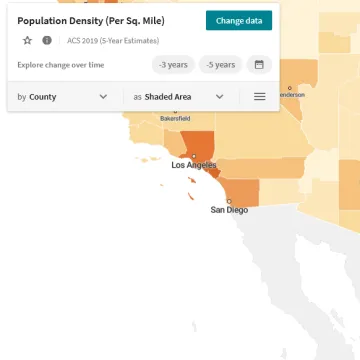
Social Explorer defaults to a population map when creating a new project or map. To change or display additional data, select the 'change data' icon. |
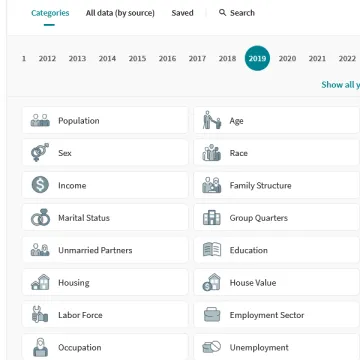
| Once the 'change data' icon is selected, a number of different datasets can be explored. Social Explorer allows for displaying multiple datasets geographically. |
Image
|
Additional Social Explorer tutorials can be found here and below.
A comprehensive search interface for data collected by the U.S. Census Bureau including demographics, housing, business, and industry. Data is provided as text files, but they will need joined to census-level geographic regions to be used in a GIS. Further information on deep linking of URL data can be found here.
Download center for U.S. Census Bureau geographic data and products. Data includes official cartographic boundary files, geographic relationship files, and reference and thematic maps.
U.S. Census Bureau Census Explorer
Web map provided by the U.S. Census Bureau displaying American Community Survey statistics including median household income, total population, foreign born, and education level by state, county, or census tract for the 1990, 2000, or 2010 national census.
SafeGraph is a data company that collects and provides data for various uses, including demographic analysis, shopping, advertising, real estate, and more. SafeGraph combines Census data with POI (point of interest) data to map consumer trends and businesses.
Some of SafeGraph's data is available to academics. View their academic portal, and their free data download page can be viewed here (census data) and here (free datasets).