
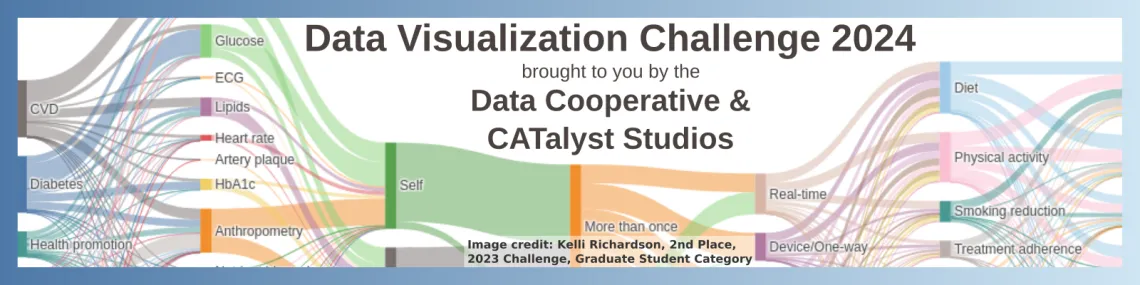
The Data Cooperative at the University of Arizona Libraries holds an annual data visualization challenge to highlight how UArizona students use visual displays of data to tell stories. The 2024 challenge is now closed for submissions. Watch this space in early 2026 for details on the next challenge.
Eligibility
This competition is open to University of Arizona students enrolled full-time for the Spring 2026 semester. Undergraduate, graduate, and professional students from all disciplines are encouraged to compete. Winners from the 2024 Data Visualization Challenge are ineligible for this year’s competition (congratulations again, BTW). Student employees and interns in the Research Engagement department are also ineligible to submit to the Data Visualization Challenge.
We value submissions that reflect the diverse perspectives and experiences of the University of Arizona student body.
All entries must be original work and the submitter must have permission to use the data in this competition. Collaborative works are permitted, although awards will be made to the individual submitting the work. Individuals may submit a single entry. All entries must be made through the official submission mechanism (see below).
Awards
Undergraduate and graduate/professional student submissions will be judged separately, and there will be first ($250), second ($150), and third ($100) place awards for both categories. All awards will be announced in early May 2026.
All awards will be processed through the Bursar's Office. Please note: Awards won may have an effect on your student financial aid eligibility. Questions regarding awards and their impact on student financial aid eligibility should be addressed to the Office of Student Financial Aid (OSFA).
Awards may also be considered taxable income. The winner is responsible for any related taxes.
Types of submissions:
Data visualizations may include but are not limited to: maps, charts, graphs, data art, and 3D models. Submissions can be static, animated, or web-based interactive stories. See Evaluation criteria, below, for information about how submissions will be judged. You can view the gallery of previous winning submissions for examples.
In addition to the data visualization submission, all entries must be accompanied by a creator’s statement, describing the work (100 words maximum) and a brief biography (50 words maximum).
To ensure fairness across different submission types, we will only consider submissions that visualize a single logical thing. Though not exhaustive, the following list gives examples for different kinds of submission types. If you would like to make sure what you have in mind is a suitable submission, please reach out to us at LBRY-data-viz@email.arizona.edu and we'll let you know.
Static visualizations
- Figures from a paper: Choose only a single figure to submit, do not submit multiple pages of figures.
- Posters: Choose a single figure from the poster, do not submit the entire poster.
- Infographics: These are acceptable as long as they visualize a single idea/story in a cohesive way.
Dynamic visualizations
- Videos: The video must visualize a single story/idea (e.g., a flyaround of a 3D model); do not submit a video or other animation consisting of a slideshow of multiple distinct figures.
- Interactive stories: The story must visualize a single idea. If the story contains multiple static visualizations (e.g., static maps, graphs), indicate which static visualization you would like the committee to consider within the context of the story.
- Dashboards: Choose a single "view" that you would like the judges to evaluate. Dashboards consisting of multiple panes may be acceptable as long as they are showing different facets of the same information.
Check out the Resources section for tools and datasets to get you started.
How to submit
All entries should be submitted through the Google form at: https://forms.gle/gJBmETJs7JDTh3nR9.
The submission requires:
Full Name
Contact information
College and departmental affiliation
Student status (undergraduate, graduate, professional)
Title of work
Abstract (limit: 100 words)
Attach file (option 1, static - specify file type, maximum file size)
Link to site (option 2 - video, interactive, can be to a video, GitHub repository, cloud storage link, other)
Agree to license terms
Agree to deposit into the UA Research Data Repository (ReDATA) if selected as a winner
Agree submission is original work
License terms
By submitting your entry to this competition, you agree to the following, which allows the University of Arizona Libraries to display and provide access to your visualization:
I grant the University of Arizona a non-exclusive license and royalty-free permission to use my visualization and accompanying text in perpetuity in their original forms and/or modified forms for the purpose of promoting the competition and the projects taking place at the University, and I have the necessary rights, permissions, and/or licenses to grant the University these rights. I understand that this means that such materials, in their original forms and/or modified forms, may be incorporated in any and all media. If I wish to revoke permissions to use my visualization, I must do so in writing to the University Libraries.
By accepting this license, you still retain copyright to your work and do not give up the right to submit the work to publishers or other repositories. The University Libraries will clearly identify your name as the creator of the submission and will not make any alteration, other than as allowed by this license, to your submission. By accepting this license, you acknowledge that you have read and agreed to the terms of this agreement and all related University Libraries policies.
Evaluation criteria
Submissions will be evaluated on the ability to convey information in a meaningful and aesthetically appealing way. When developing a submission, participants should consider the following:
Are the data accurate and from a reliable source?
What is the message or main point of the visualization?
Is the visualization clear to a non-specialist?
Is this a novel way of displaying the data at hand?
Does the visualization use space and color in an effective way?
If the submission is interactive, is it intuitive?
Submissions using open and reproducible methods are strongly encouraged to apply.
Exhibition of submissions
Winning submissions will be made accessible through the Data Visualization Challenge website and the University of Arizona Research Data Repository.
If you have additional questions, see our Frequently Asked Questions page.