
2024 Challenge Winners
Winning entries are also available as a collection on ReDATA, the UA Research Data Repository.
Ben Ge, First place, Undergraduate student: ‘2021-2024 Tucson Auto Accidents’Image
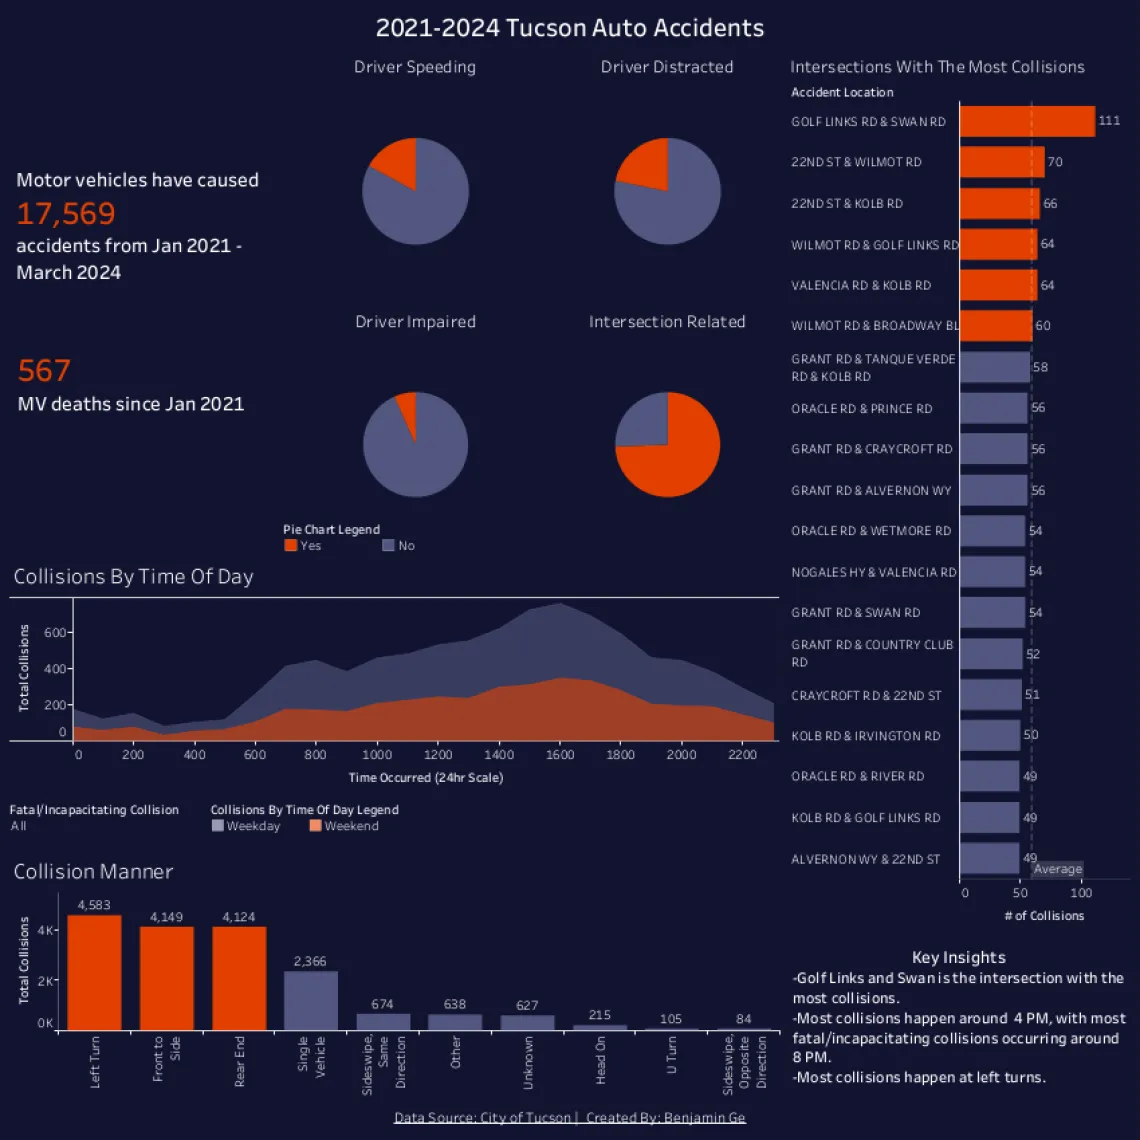
Ben Ge I spent most of my life biking to school, which eventually led to becoming a cyclist. Because of my background, I am keenly aware of how dangerous motor vehicles are to all parties involved. Knowing many are affected by auto-related accidents, I decided to create a data visual that communicated relevant information to the population most likely to see my work. I found a dataset from the Tucson Police Department and used it to highlight the most important aspects. If my visual could prevent even one accident, my visual would be well worth the work.
|
Travis Zalesky, First place, Graduate/Professional student: ‘The Olympic States of America’Image
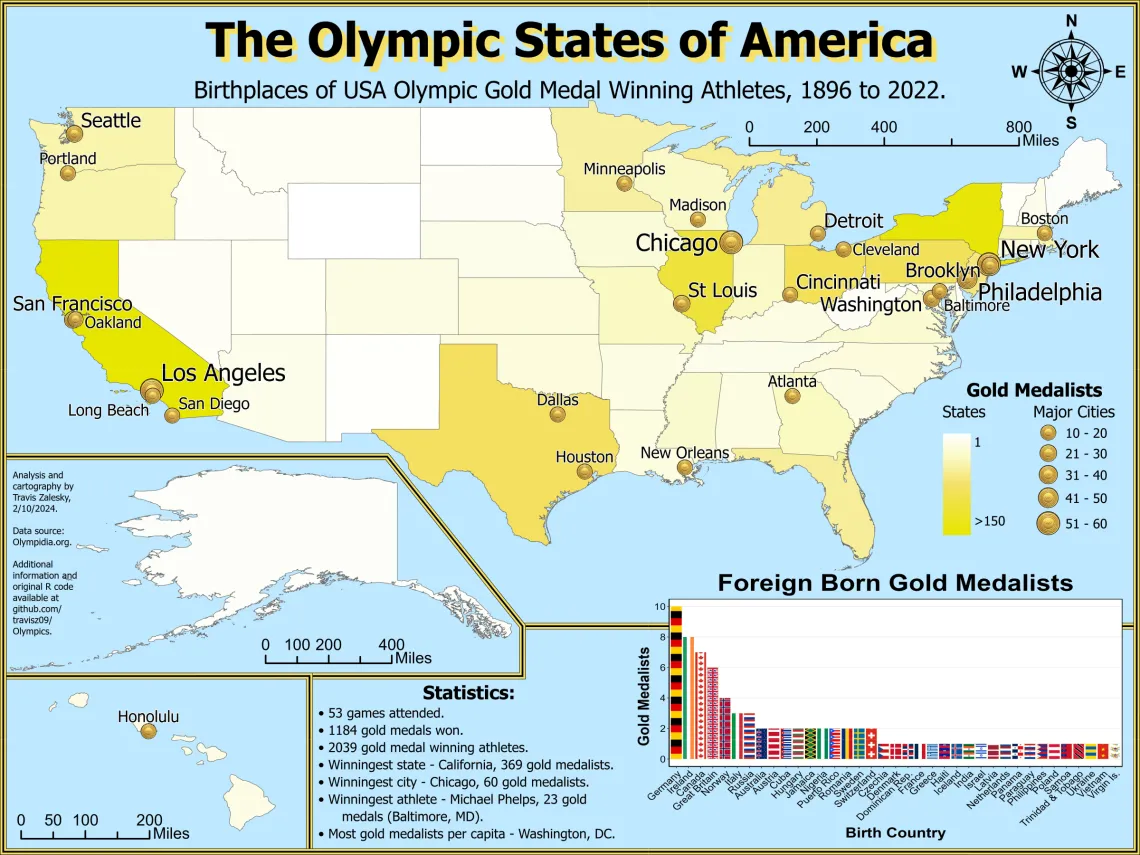
Travis Zalesky 2024 is an Olympic year! To promote interest in this year’s Summer games I wanted to explore the history of American Olympians. Therefore, my map presents the birthplaces of every Olympic gold medal winning athlete competing for team USA from the start of the modern Olympics (1896) to the last Olympic games (2022). Data was obtained from Olympedia.org. Data was collected and analyzed using original R code, and data visualizations were generated in R and ArcGIS Pro. Additional information and R scripts can be found on my GitHub page (https://github.com/travisz09/Olympics).
|
Travis Matlock, Second place, Undergraduate student: ‘Buffelgrass Green-Up Forecasted by Precipitation Events’Image
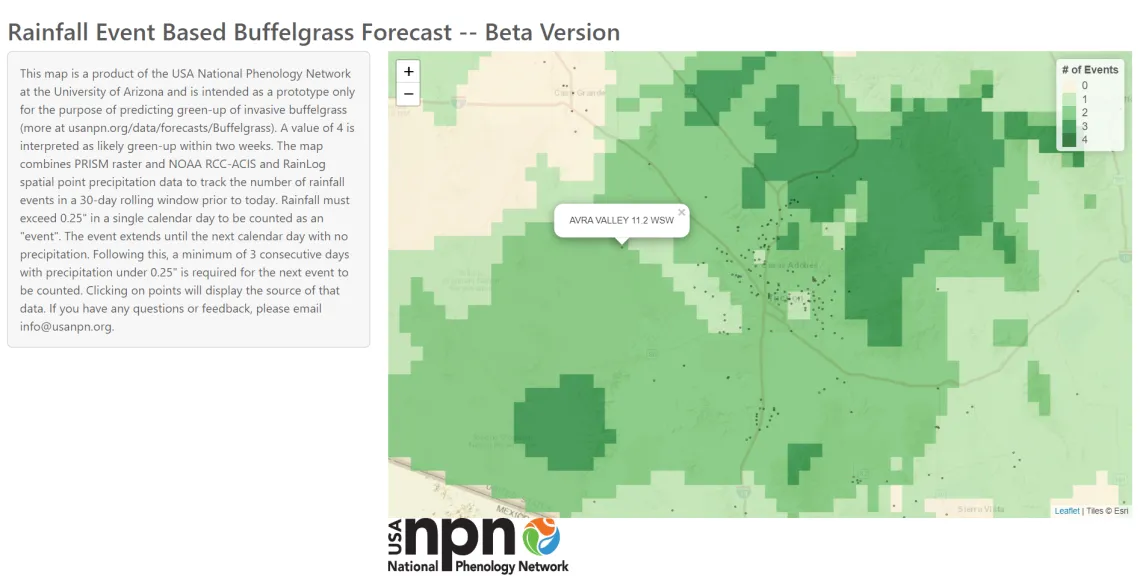
Travis Matlock This daily-updated interactive map uses precipitation data to forecast the green-up window of buffelgrass in Arizona. Buffelgrass is an invasive species that provides fuel and ground cover for wildfires to spread and is notoriously difficult to treat, only responding to herbicides in a narrow green-up window. The number of distinct rainfall events in the previous month is calculated and mapped. Raster data is taken from the PRISM climate group’s API and spatial point data is taken from NOAA’s RCC-ACIS API and RainLog’s API. The map is a product of the USA National Phenology Network.
|
Sarah Leighton, Second place, Graduate/Professional student: ‘How Service Dogs Benefit the Daily Well-Being of Veterans with PTSD’Image
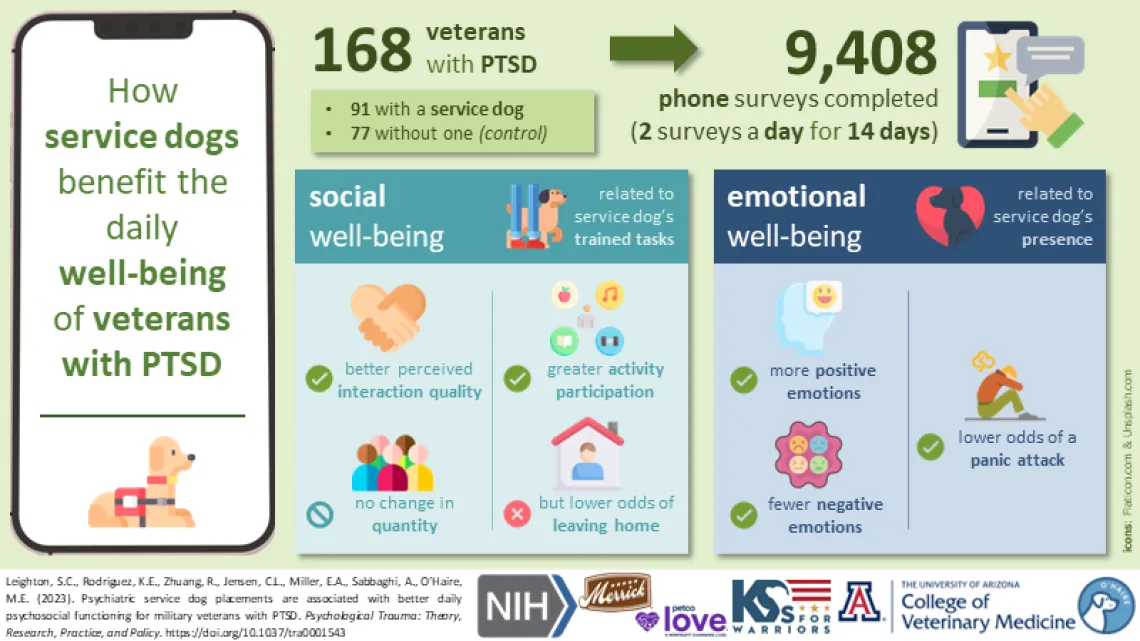
Sarah Leighton This graphical abstract provides a visual overview of a study that looked at how partnership with a psychiatric service dog affects veterans with posttraumatic stress disorder (PTSD). Veterans with PTSD are increasingly seeking service dog partnerships as a complementary intervention alongside more traditional forms of PTSD treatment. Our research provides a unique glimpse into the in-the-moment social and emotional experiences of veterans involved in a service dog program, collected through short, randomly timed check-in surveys delivered directly to their smartphones. |
Katie Hefner, Third place, Undergraduate student: ‘Wardrobe Graph’Image
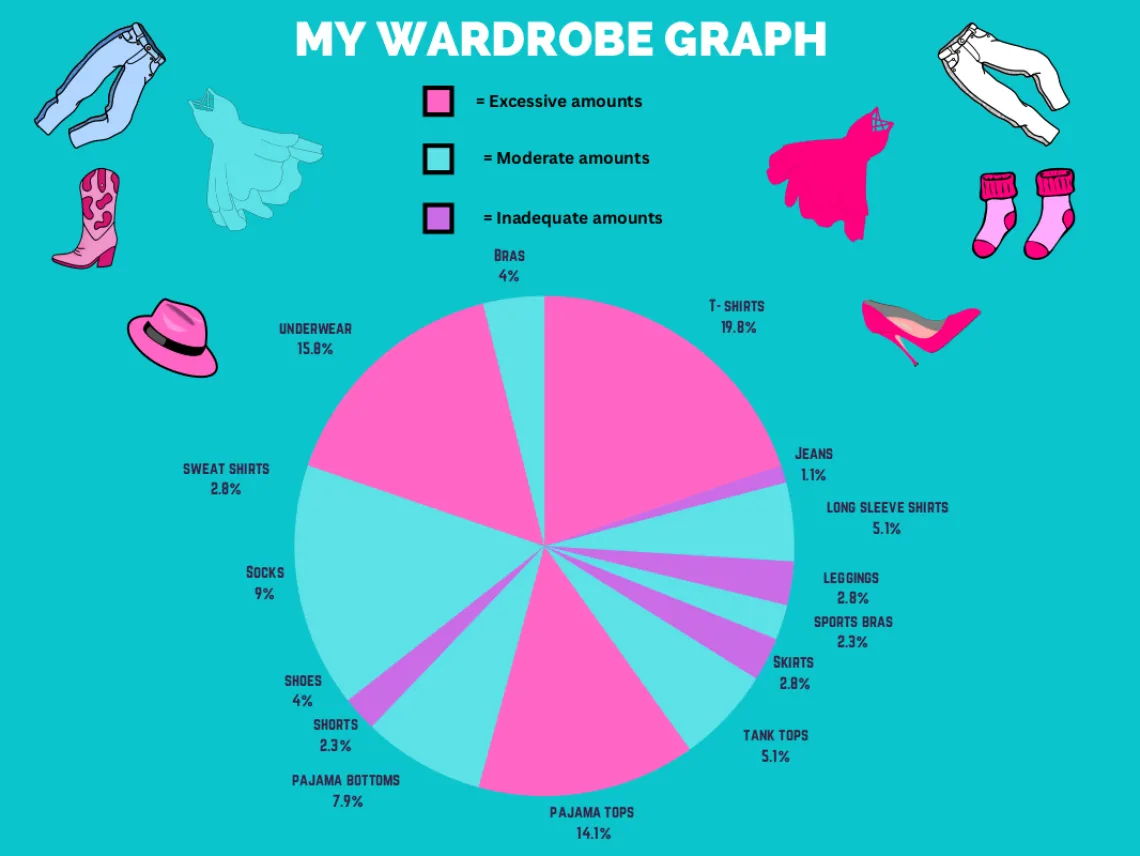
Katie Hefner This was a chart I made to demonstrate how much clothing was in my closet. We had to count articles of clothing that we owned and include a percentage of each in a chart. The purpose was to recognize our consumption and how much more or less we needed a particular clothing item. |
Anik Das, Third place, Graduate/Professional student: ‘Crime Trend Around UofA Campus’Image
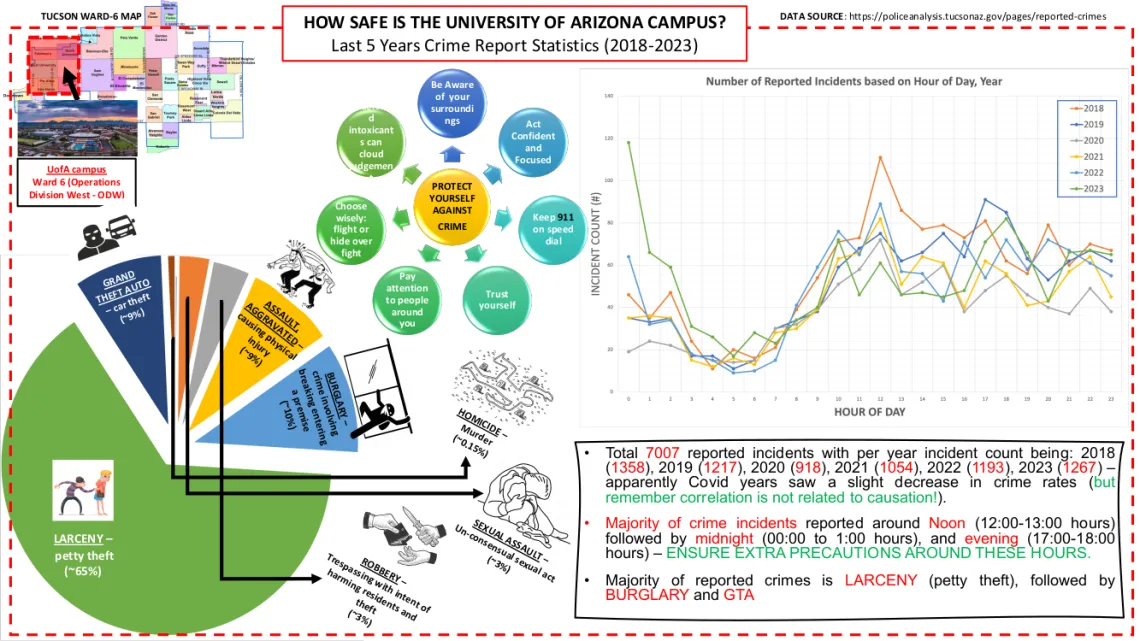
Anik Das With frequent UAlert notifications I was curious about the recurrence of crime rates around Ward 6 - ODW region of Tucson i.e. where the UofA campus is located. My poster has three simple objectives, for a 5-year period (2018-2023), I decided to: 1) simply map out a count of incidents based on hour of the day , and 2) find the percentage distribution of the major crime categories (based on categorization by the Police Dept), 3) provide some simple yet popular techniques to protect yourself. All data is taken from Tucson Police Dept. website. |
Partha Koundinya Panguluri, Honorable mention, Graduate/Professional student: ‘Tiger Terrains and Timelines: Visualizing India’s Tiger Territories’Image
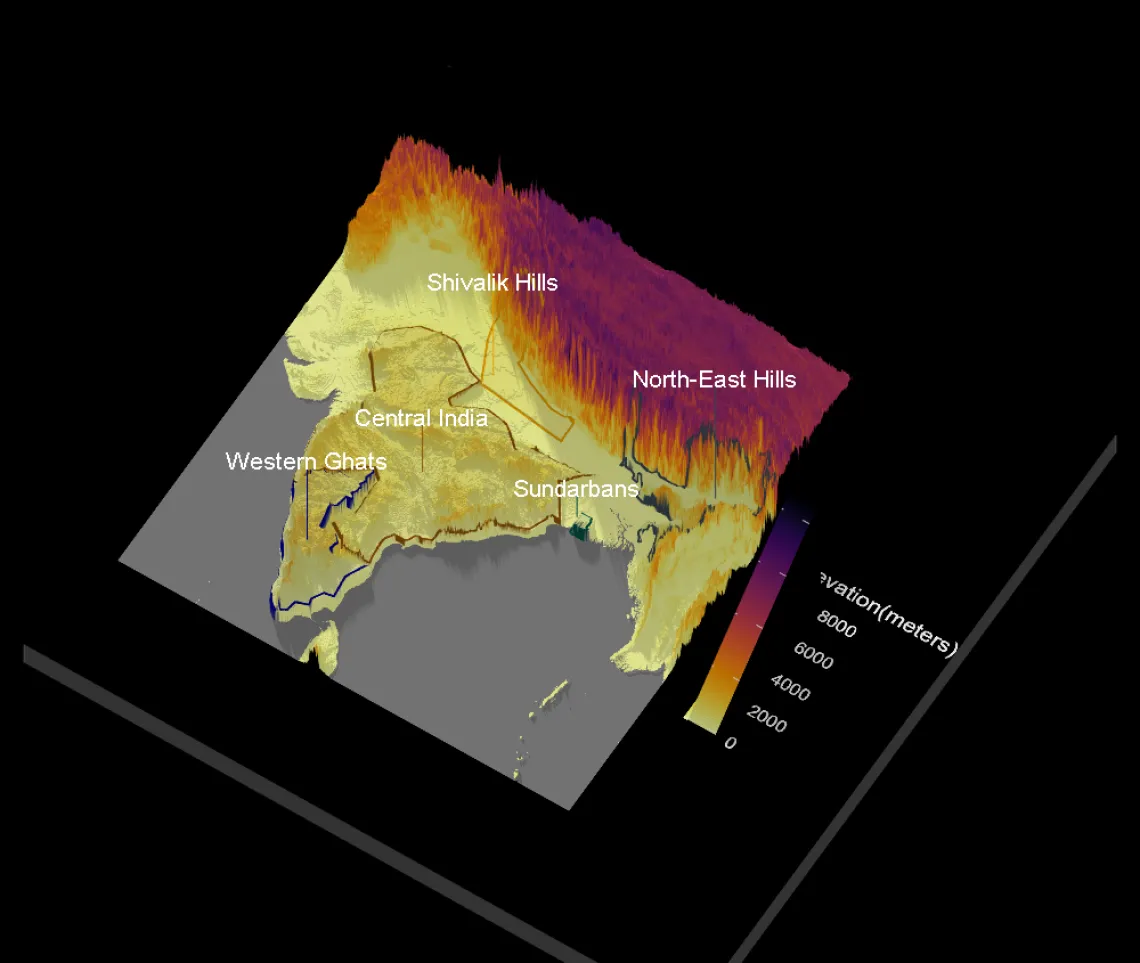
Partha Koundinya Panguluri The recent report on the status of tigers by the National Tiger Conservation Authority (NTCA) of India estimates a significant increase in tiger population across the country. The tiger-populated habitats within the nation have been categorized into 5 landscapes. The present work aims to visualize these landscapes as an interactive 3D model using spatial data, and the tiger population using a line plot. It was observed from the plot that there has been an increase in the number of tigers since 2006. Hopefully, conservation efforts will continue to yield much better results. Data Sources: https://ntca.gov.in/assets/uploads/Reports/AITM/status_of_tiger-copredators-2022.pdf obtained from https://ntca.gov.in/. |
2023 Challenge Winners
Winning entries are also available as a collection on ReDATA, the UA Research Data Repository.
Stefan Marinic, First place, Undergraduate student: 'America's Toothache'Image

Stefan Marinic Growing up, I was always immersed in the field of dentistry, but couldn't help but notice that Oral health and hygiene seemed to always take a back seat in the healthcare community. The lack of education is terrifying to say the least, and America's oral health is now suffering the consequences. I made an infographic to visualize some of the alarming statistics, and bring an overall greater awareness to our personal hygiene. While we often associate health with the heart, lungs, brain or other major organs, a large number of serious health problems in the United States can be traced to our mouths.
|
Ethan Stoneburner, First place, Graduate/Professional student: 'Arizona Active Mines and Energy Producers'Image
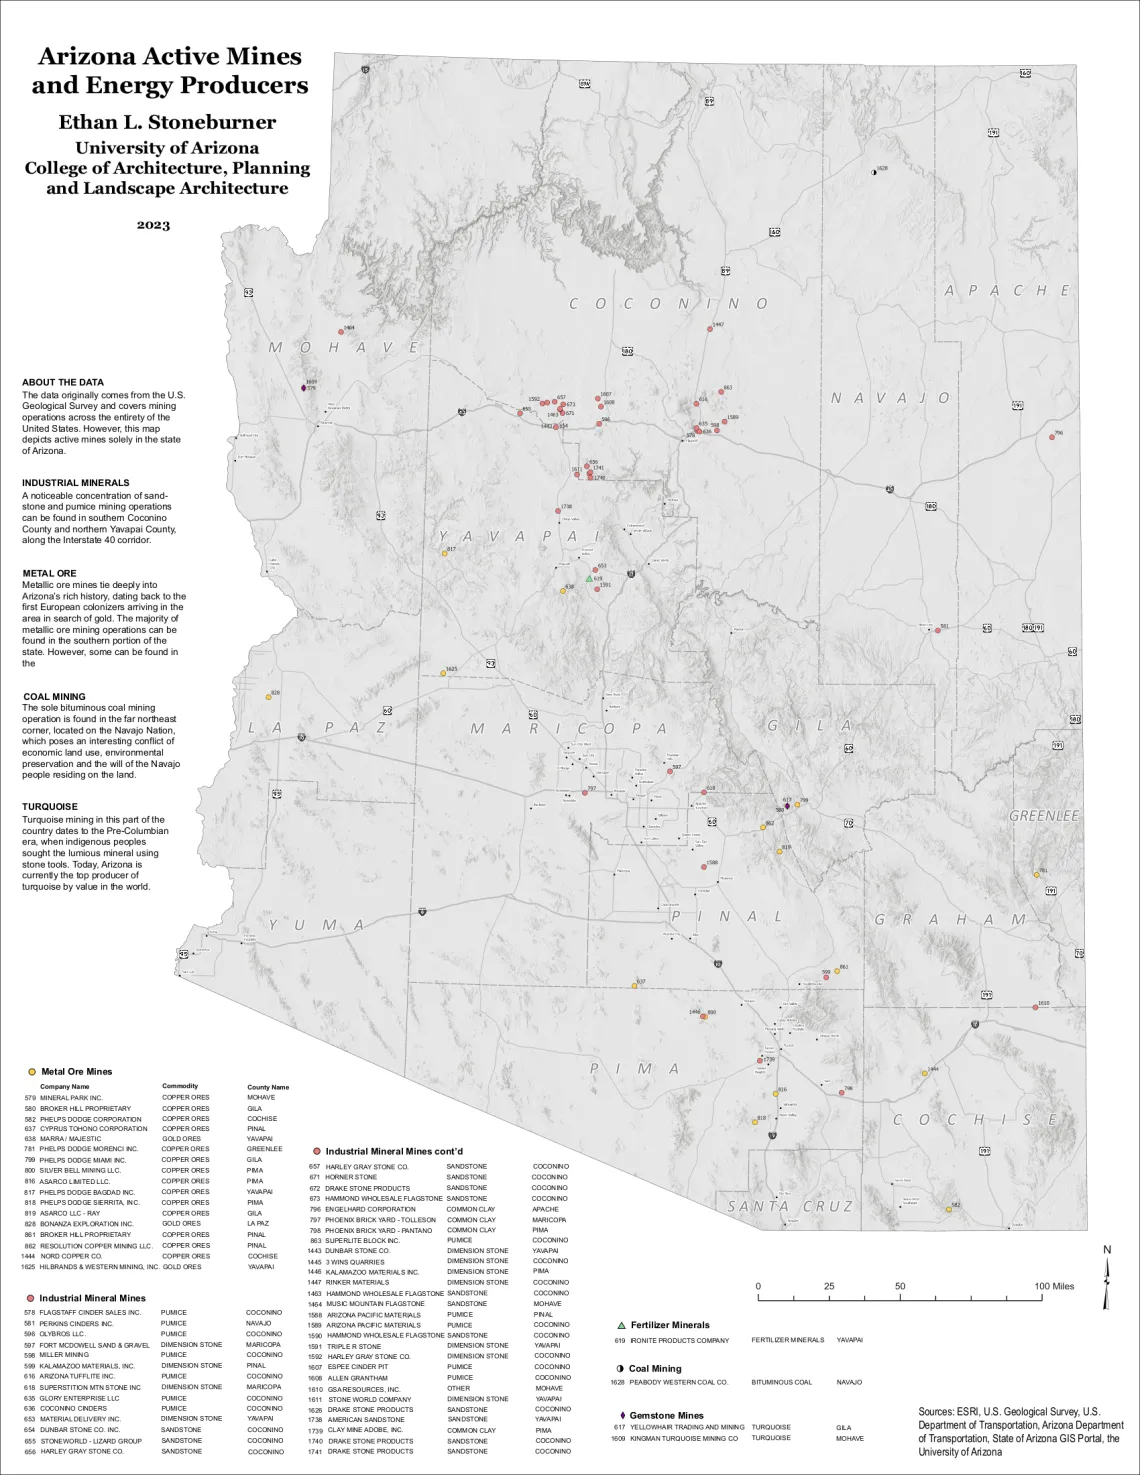
Ethan Stoneburner This visualization depicts the locations and contents of 63 of Arizona's active mining or energy production sites as designated by the United States Geological Survey. These operations include metallic ore, gemstone, fertilizer mineral and coal mining within the state, although the vast majority of active operations extract industrial minerals including sandstone, dimension stone and other commonly used construction materials. The data comes from the USGS, as well at the U.S. Department of Transportation, the State of Arizona GIS Portal and the University of Arizona. |
Kate Louis, Second place, Undergraduate student: 'Climate Change and Hurricanes'Image
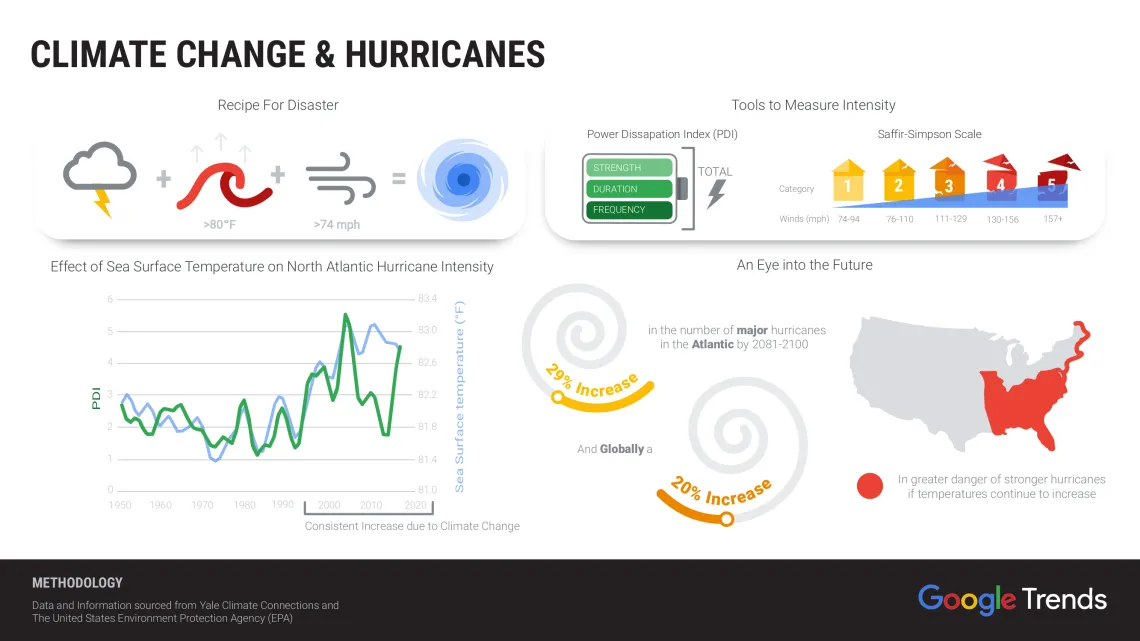
Kate Louis My infographic starts with the “ingredients” for a hurricane followed by the two methods of measuring intensity; The PDI as represented with a battery and the Saffir-Simpson Scale through the damage of a housing structure. With a basic understanding built, viewers can read a line graph proving the correlation in rising sea temperatures and increased hurricane intensity. What does this mean to my audience? There will be an increase in the number of strong hurricanes if temperatures continue to increase and taking action against global warming is covertly encouraged. Data and information sourced from Yale Climate Connections and The EPA. |
Kelli Richardson, Second place, Graduate/Professional student: 'Health Behavior Change Interventions Using Biological Feedback'Image
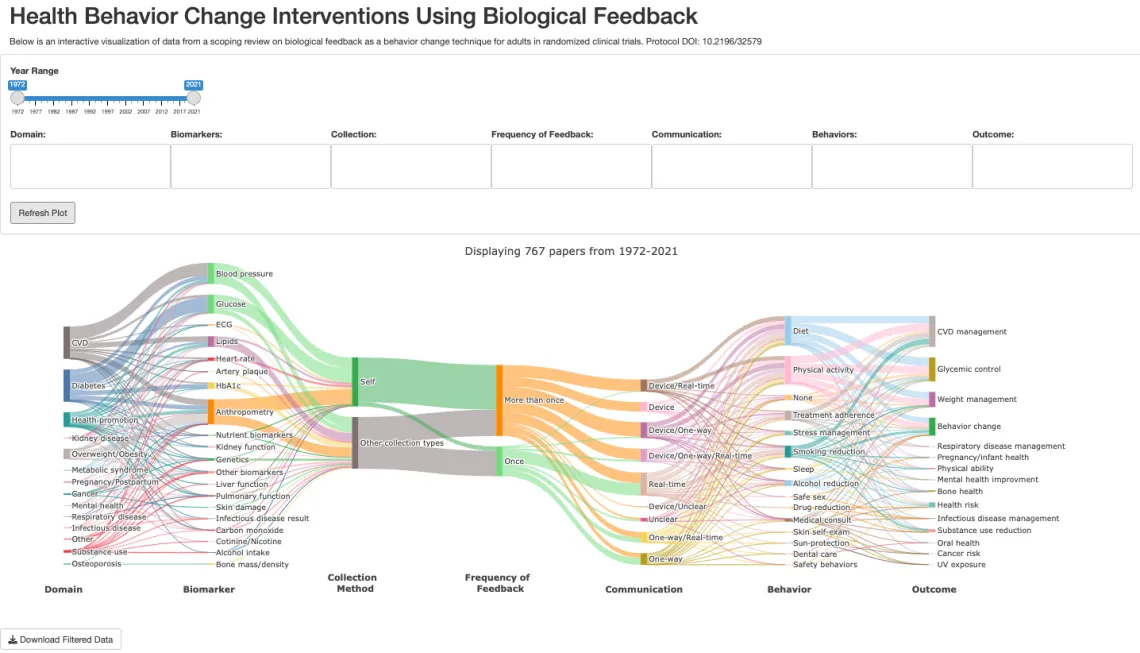
Kelli Richardson This interactive visualization represents data extracted from 767 articles included in a scoping review on the topic of using biological feedback as a behavior change technique in adults. The height of each node represents the quantity of articles from which that variable was extracted. The links between nodes demonstrate the proportional relationship between variables. Viewers can filter the diagram by year and variable to best suit their interests. The filtered data, which include the DOIs and PubMed IDs, can then be downloaded so the viewer can use the relevant articles to support their own research. |
Arjun Phull, Third place, Undergraduate student: 'Black Space and the Environment'Image
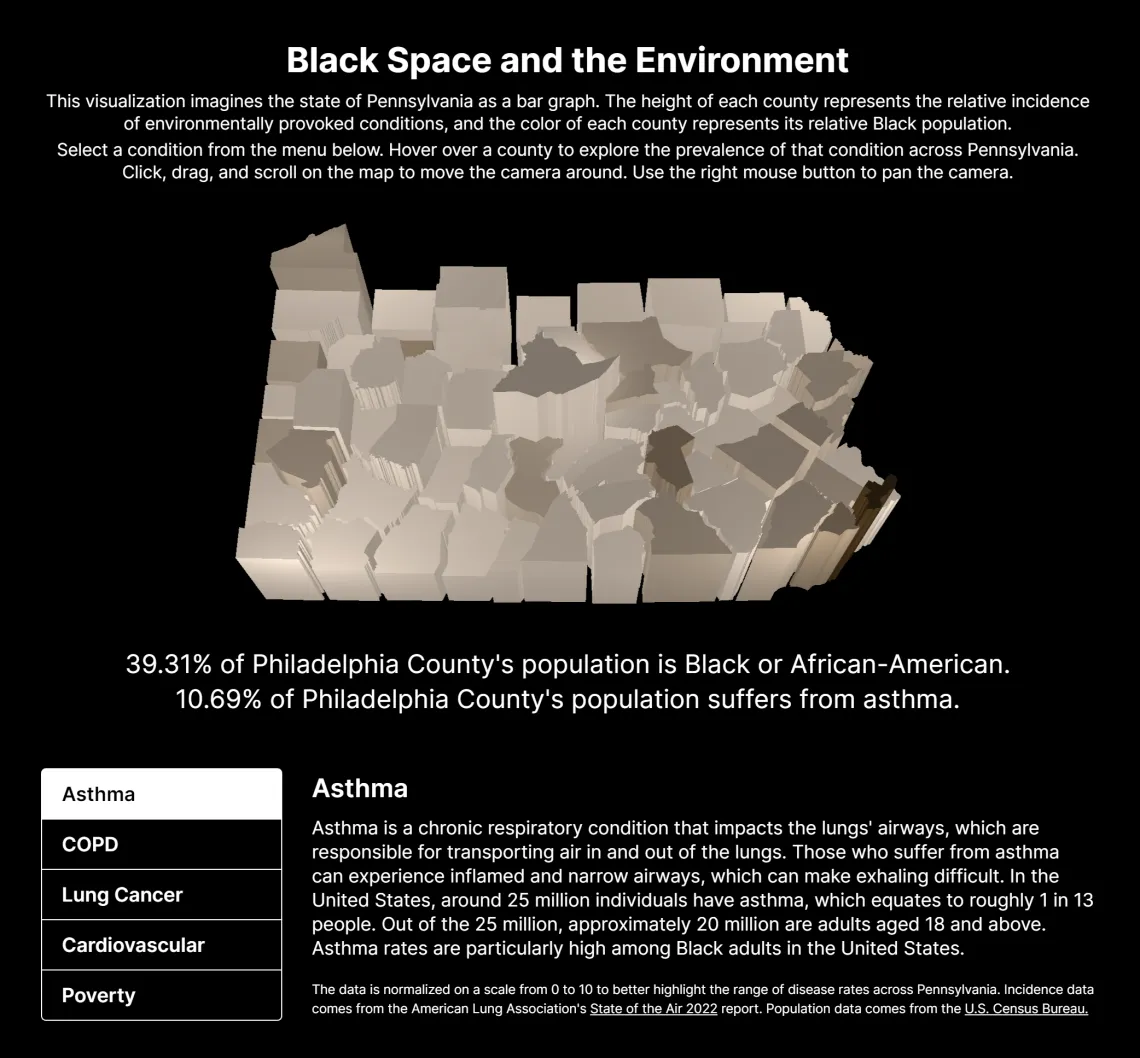
Arjun Phull "Black Space and the Environment" is a dynamic 3D data visualization project inspired by W.E.B DuBois's 1900 exhibit "The American Negro". Focusing on Pennsylvania, the project uses color and spatial analysis to reveal the impact of environmental conditions on the state's Black population. The visualization draws on data from the American Lung Association's State of the Air 2022 report and the U.S. Census Bureau to highlight correlations between disease rates and Black population density. This project aims to analyze the differential impacts of certain conditions on Black Americans and invites viewers to consider ways to combat these disproportionate outcomes. |
Kamila Murawska-Wlodarczyk, Third place, Graduate/Professional student: 'Revealing the Inner Structure of Atriplex lentiformis Seeds'Image

Kamila Murawska-Wlodarczyk This figure showcases the perianth of Atriplex lentiformis (A), with a photograph of the seed in longitudinal section (B), as well as a schematic representation of six distinct seed structures (C) that were used for interpreting synchrotron-based X-Ray Fluorescence Microscope (XFM) images. These structures include the seed coat, shoot apical meristem, cotyledons, procambium, and root tip zone. The image provides a comprehensive view of the reproductive tissues and structures of Atriplex lentiformis seeds, making it a valuable tool for gaining insight into the biology of this species. |
Bailie Wynbelt, Honorable mention, Undergraduate student: 'Walkability in the United States'Image
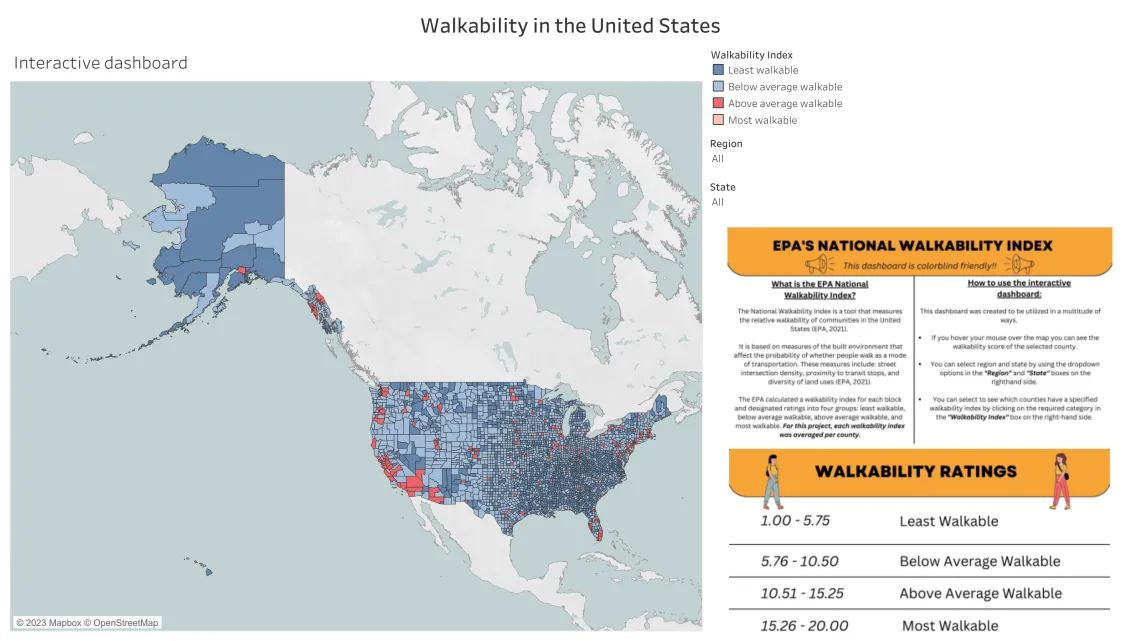
Bailie Wynbelt In 2019, the EPA released a census that included walkability ratings of various neighborhood blocks throughout the United States. For this contest, I created an interactive map that displays walkability throughout the United States. More specifically, walkability ratings were grouped by county and placed into an index grouping based on those formulated by the EPA. In the visualization, there is a description of the EPA walkability index. This was designed with the intention of allowing anyone to open the graphic and understand what data it is displaying. Additionally, you can filter by region and state based on preferences. Background document (Describes the walkability index): https://www.epa.gov/sites/default/files/2021-06/documents/national_walkability_index_methodology_and_user_guide_june2021.pdf |
2022 Challenge Winners
Winning entries are also available as a collection on ReDATA, the UA Research Data Repository.
Riley Zuckert, First place, Undergraduate student: 'University Homework Costs Interactive Dashboard'Image

Riley Zuckert Universities are notorious for charging students large amounts of money to purchase necessary supplies for school, such as textbooks and homework access codes. Student success is the vision for colleges, but does the sheer amount of money students pay to obtain an education and associated materials hinder their ability to flourish? To understand the root of the problem, the amount of money University of Arizona students pay to acquire their textbooks and homework codes in a semester was analyzed through a talk back board. This data was collected through a UA Libraries UX Team initiative, led by Riley Zuckert (https://www.notion.so/University-textbook-and-homework-costs-04a4c16bc60...).
|
Irene Pineda, First place, Graduate/Professional student: 'Plant Trees in Pomona for a Sustainable Future'Image

Irene Pineda The city of Pomona, named after the Roman goddess of fruit, historically was known to be as rich as its fertile soil. It now has become dominated by commercial buildings often paired with oversized parking lots. An environmental analysis was conducted to help better understand which areas of the city are in desperate need of vegetation. Observing impervious surfaces vs pervious, the maps generated provided insight of where trees should be planted to combat the heat and ultimately make the city more sustainable for future residents. A handful of sources were used through GIS, USGS, EPA, and Census data was also retrieved. |
Sydney Brandt, Second place, Undergraduate student: 'Sydney's Spotify Listening Frequency'Image

Sydney Brandt I have always been inspired by websites created using Spotify's API. I wanted to create a project using my own listening data; I downloaded my data from the Profile settings on Spotify's website. From there, I imported the JSON files into RStudio, took a look, and developed my 24-hour listening clocks. They capture many of my music habits: I stream music more in the evening and night, I traditionally play my study music around 7pm to 2am, and I listen to my roadtrip music the most around 8pm and 4-5am (the times I typically commute to and from Phoenix). |
Liliana Salas, Second place, Graduate/Professional student: 'Bogota Population Density and Spatial Distribution of Bus Stops'Image

Liliana Salas This dashboard presents Bogota's population density per Urban Planning Unit (UPU). UPUs are on a yellow to red scale, being the red ones the densest UPUs. The bar chart on the right-hand side shows UPUs sorted descendent based on the number of bus stops they have within their boundaries. When clicking any of those bars, that UPU is shown on the map. There are also two filters that allow selecting UPUs by both population density and number of bus stops. Is the number of bus stops per UPU proportional to population density across the city? Sources: https://datosabiertos-transmilenio.hub.arcgis.com/ and https://sdpbogota.maps.arcgis.com
|
Dylan Girone, Third place, Undergraduate student: 'Weather Satellite Imagery: Dual-frequency Precipitation Radar'Image
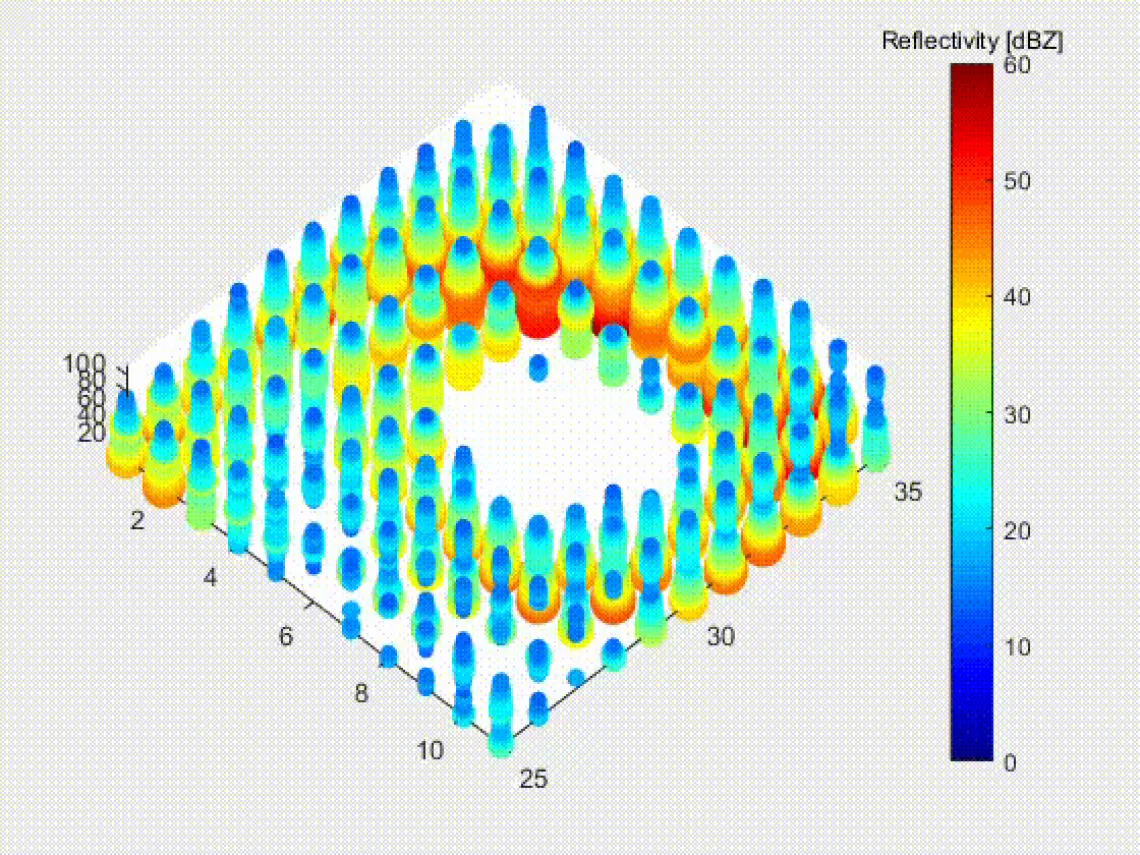
Cloud structure and composition can be determined by measuring the reflectivity of a storm. Liquid water reflects light more than ice crystals or hail so the region of the storm responsible for the most rainfall can be diagnosed as the region with highest reflectivity. NASA’s Dual-frequency Precipitation Radar (DPR) uses microwave imagery to create a composite 3D image of the cloud’s reflectivity in 5-kmx5-km grids every 125m (about 410.1 ft) vertically. The accompanying animation displays that data for the Eye of Hurricane Ida just before it made landfall in Louisiana on August 29, 2021. Data Retrieved from GES DISC (nasa.gov). |
Sarah Eggleston, Third place, Graduate/Professional student: 'Male Contraception'Image

Sarah Eggleston This infographic on male contraception shows highlights issues, facts, and figures on both sides of the debate as to whether men should have as many contraception choices as women. To construct this infographic, information was drawn from various medical information sources across the web and are listed on the infographic itself. This multimodal composition was created as a class assignment in TLS 530: Literacy and Technology. |
Duan Copeland, Honorable mention, Graduate/Professional student: 'Meta-Analysis of the Honey Bee Bacteriome'Image

Duan Copeland This Krona projection are the results of a meta-analysis of the honey bee gut bacteriome. We identified 26 studies spanning four continents, comprising 3000 western honey bee, Apis mellifera, gastrointestinal tract samples targeting bacterial 16S rRNA genes. Honey bees have a relatively simple and stable microbiota consisting of ten major phylotypes: Lactobacillus, Gilliamella, Snodgrassella, Bombilactobacillus, Frischella, Bifidobacterium, Bombella, Apilactobacillus, Commensalibacter, and Bartonella. Other taxa belonging to the rare biosphere (low abundance and prevalence) warrant further investigation. Click the “Color by % Prevalence” toggle and explore the interactive dataset through different honey bee gut niches refined to >97% bacterial species similarity.
|
2021 Challenge Winners
Winning entries are also available as a collection on ReDATA, the UA Research Data Repository.
Tintin Nguyen, First place, Undergraduate student: "The Probability of Coin Toss"Image

The Law of Large Numbers and the Central Limit Theorem are two of the most fundamental and elegant theorems in Probability Theory. However, these concepts are impractical to demonstrate because they require an immense number of trials to observe the long-term behaviors of random variables. Therefore, this case study runs computer simulations on coin tossing as an intuitive example to explain these statistical concepts. The visualizations provide insights into the theorems without mathematically rigorous proofs, making them accessible for introductory statistics learners. |
Heidi Steiner, First Place, Graduate/professional student: "Trends in Affirmative Asylum Grantees in the United States"Image

Every year people come to the United States (US) seeking protection because they have suffered persecution or fear that they will due to their race, religion, nationality, or membership in a particular social group. Asylum is a protection granted to foreign nationals already in the US or arriving at the border who meet the international law definition of a ârefugeeâ. This visualization aims to understand population movement during the last 20 years. I use aggregated refugee and asylee data from the Department of Homeland Security. I show patterns in population movement vary over time based on political failures preceding movement. |
Melanie Gin, Second Place, Undergraduate student: "Top Reason Books Were Challenged By Age Group Between 2010-2019"Image

|
Elaine Rhee, Second Place, Graduate/professional student: "Golden State Warriors Passing Analysis (2020-2021)"Image

The graph presents the passing analysis of the Golden State Warriors (2020-2021). The data is from the official NBA website. Graph interpretation: The greater the size of the dots, the more a player interacted with the other players. The thicker the line, the more score was earned from the two players’ passes. Features of the graph: - Click on a player to highlight the player’s part of the graph. - Hover on the dots to see the list of players that a player interacted with. - Move around the dots wherever you want to customize the graph. - Zoom in or out. |
Ashwin Raj, Third Place, Undergraduate student: "Clustering NBA Players Based on Offensive and Defense Skillset"Image

This project uses 2019 NBA Player data from basketball-reference to cluster NBA players into roles based on their offensive and defensive skillsets. Using 3-pointers made as the offensive metric and steals as the defensive metric, and then standardizing these metrics per 36 minutes, players were clustered as Low-Impact, Bench Defense, Bench Offense, Shooters, Two-Way, and Elite. Teams can use this data about their players to determine rotations, offensive & defensive strategy, and even potential trades. The cluster analysis was done using K-Means with k=6, and the interactive plot was created using GGPlot and Plotly.
|
Kathryn Busby, Third Place, Graduate/professional student: "The Birds and the Bees: Can a plant prevent woodpecker predation on a native bee?"Image

Complex conditions drive organisms’ strategies, including interactions with antagonists. We examined a predator-prey interaction between native bees and their woodpecker predators that may be altered by the bees’ nest plant. In southeastern Arizona, carpenter bees build nests inside dried inflorescence stalks of plants such as sotol. Woodpeckers prey upon carpenter bee larvae inside these stalks, but sotol’s dense rosette of barbed leaves may protect larvae. We hypothesized that nests surrounded by leaves would be less accessible to woodpeckers, increasing predation on higher nests. This could drive nest placement. To test this hypothesis, we recorded locations of nests, rosettes, and predation. |
Torin Hodge, Honorable Mention, Undergraduate student: "Unregulated Industrial Well Drilling in Rural Southeast Arizona"Image

The purpose of this visualization is to demonstrate the threat of unregulated groundwater pumping in rural Arizona. The data comes from publicly available well registry data provided by azwater.gov. My Grandmother has lived in the area near the sample data for thirty years and has growing concerns about her well running dry due to competition from neighboring cattle-feed growing operations, many of which are from out of state.
|
Christina Scarpitti, Honorable Mention, Graduate/professional student: "Resilient Energy: Community-Scale Microgrid Siting on the Island of Puerto Rico"Image

In the wake of hurricane Maria, after suffering the longest power outage in US history, the Governor of Puerto Rico endorsed a plan to transition the island to 100% renewable energy by 2050 - making Puerto Rico a unique testing ground for building back smarter and more resilient through community-scale solar microgrids. This report evaluates possible sites for piloting community-scale solar microgrid projects in Puerto Rico. Geographic Information Systems (GIS) data is used to select a study area based on social and environmental vulnerability. A multi-criteria evaluation of buildings within the study area reveals various possible configurations for providing renewable, resilient energy to the service community. |
2020 Challenge Winners
Winning entries are also available as a collection on ReDATA, the UA Research Data Repository.
Reagen Leimbach, First place, Undergraduate student: "Stacking of Galaxy Spectra"Image

|
Kelsey Gonzalez, First place, Graduate/professional student: "How has human mobility changed under the COVID-19 Pandemic?"Image

|
Jazmyn Winzer, Second place, Undergraduate student: "Botanical Gardens as Butterfly Hotspots in Urban Landscapes"Image

|
Miranda Rintoul, Second place, Graduate/professional student: "The Price of Fertility"Image

|
Rob Lucha, Third place, Undergraduate student: "Wage & Value"Image

|
Stephanie Martin, Third place, Graduate/professional student: "Vesuvius Past and Present: Modern emergency planning compared to ancient hazards"Image

|